

Two commercial risks arrive with the same class, the same limits, and the same loss history. One underwriter returns a quote the broker accepts. The other returns a number far enough away that the broker asks what changed. Nothing about the risk changed. Something about how it was priced did.
That gap is pricing variance. Some of it is deliberate and defensible. The rest is unplanned, and it erodes rate adequacy, confuses brokers, and makes portfolio results harder to explain.
This article shows where pricing variance starts, how underwriter judgment adds to it, how to measure it in your own book, and how to reduce it without taking judgment away from your underwriters.
What Is Pricing Variance, and When Does It Become a Problem?
Pricing variance is the spread in quoted premium across risks that share the same exposure profile. It shows up when two underwriters, two offices, or two renewal cycles produce different prices for what looks like the same account.
Variance is not the enemy. Price should move when the risk moves. The problem is variance that has nothing to do with the risk.
Signal Versus Noise
Split variance into two kinds. Signal is variance explained by real differences in the risk, such as protection class, construction, occupancy, or loss experience. Noise is variance explained by who handled the file or how the file was presented.
Here is a quick test. If you can state the risk-based reason for a price difference in one sentence, it is signal. If the honest answer is "the underwriters read it differently" or "the broker formatted it differently," it is noise.
The Four Types of Variance
Noise has more than one source, and each source needs a different fix. Sorting your variance into these four types is the first step toward reducing it.
Type | Example | Where the fix lives |
|---|---|---|
Signal | A building with no sprinklers is quoted higher than an identical building with them | Document the rationale and keep it |
Input noise | The same building is quoted differently because exposure details were captured differently | Intake standards |
Judgment noise | Two underwriters apply different schedule credits to the same account | Guardrails and reason codes |
System noise | A rating output is edited off-model because the underwriter distrusts it | Feedback loop with the pricing team |
Why Unexplained Variance Costs You
Underpricing erodes rate adequacy on accounts that should have carried more premium. Overpricing loses accounts that deserved a sharper quote.
Brokers notice too. A broker who sees inconsistent quotes from the same carrier stops trusting the carrier's pricing and starts shopping every account. Portfolio reviews then turn into arguments about why results differ instead of decisions about what to do next.
Where Pricing Variance Starts: The Submission-to-Quote Variance Map
Variance does not begin at the moment of quoting. It builds across the whole path from submission to price. We call this path the Submission-to-Quote Variance Map, and it has five points where the same risk can drift.
Point | What varies | Typical symptom |
|---|---|---|
1. Intake | Structure and completeness of the submission | Clarification cycles and late changes |
2. Classification and exposure | Class codes, valuations, and schedules entered differently | Different base rates for the same risk |
3. Reference material | Which guideline or appetite document gets used | Inconsistent eligibility and terms |
4. Judgment | Credits, debits, and overrides | A wide gap between technical and quoted price |
5. Handoffs | Re-keying across systems | Transcription differences in rating inputs |
Point 1: The Submission Itself
The exposure can stay the same while the documentation changes. A 2026 analysis from Insurance Support World describes a contractor renewal where the risk was unchanged but the vehicle schedule arrived as an unstructured spreadsheet and equipment values arrived as a single total.
The same analysis makes a point worth repeating: when submissions lack structure, accuracy depends on manual interpretation, and variability in documentation turns into variability in evaluation. Two underwriters handed two differently formatted versions of one risk will not start from the same facts.
Points 2 and 3: Classification, Exposure, and Reference Material
Consider a schedule of values. One file lists every location with its own valuation. Another rolls the locations into a single figure. Both describe the same property, but the rating inputs an underwriter can build from each are not the same.
Reference material adds a second layer. In Federato's 2025 State of Underwriting Report, a survey of 500 underwriters and executives, 56% of respondents said they still rely on static guidelines such as PDFs and spreadsheets to assess fit.
When guidance lives in documents that drift out of date at different speeds, two underwriters can apply two different versions of the same rule.
Point 5: Handoffs Between Systems
Every time a value is re-keyed from a submission into a rating tool, the value has a chance to change. A transposed digit, a missed endorsement, or a rounded valuation moves the price without anyone deciding to move it.
This type of variance is the easiest to miss because no one chose it. It does not appear in a deviation report, because the underwriter never intended a deviation.
How Underwriter Judgment Adds Variance
Judgment is the reason commercial underwriting exists. Rating plans cannot capture every feature of a risk, so underwriters adjust. The challenge is that adjustment without a shared standard produces different answers from equally capable people.

Credits, Debits, and Overrides
Schedule rating lets an underwriter move a price within a band to reflect factors the rating plan does not capture, such as management quality, safety programs, or premises condition. One underwriter reads a strong safety culture and grants a credit. Another sees the same file and grants nothing.
Neither decision is wrong on its face. Without a documented standard for what earns a credit and how large it should be, the result is a spread in price that no one can explain later.
Off-Model Workarounds
Pricing models only help when underwriters use them. A 2025 post from hyperexponential notes that when underwriters do not see the value in a pricing model, they often revert to manual or ad hoc calculations, which undermines consistency and weakens the feedback loop.
The cost compounds. Workarounds leave no clean record, so the data that would recalibrate the model never reaches the pricing team, and the gap between the model and the field widens.
Time Pressure and System Load
Underwriters work under volume. In the same Federato survey, 60% of the underwriters surveyed reported juggling seven or more systems in the underwriting process. Each system adds another place to look up a rule, another screen to re-key a value, and another chance for two people to take different paths.
Under time pressure, people take shortcuts, and shortcuts differ from person to person. That is judgment noise and system noise arriving together.
When Variance Is Legitimate
Not every difference needs fixing. A new account can be priced differently from a renewal because the carrier holds different information. Appetite shifts by segment, market conditions move, and strategic accounts earn different treatment.
The standard is not "no variance." The standard is "every variance has a reason someone can state." That standard is what separates healthy discretion from drift.
How to Measure Pricing Variance in Your Own Book
You cannot reduce what you have not measured. The good news is that most carriers already hold the data needed for a baseline. Follow these steps on one line of business first.

Define a cohort of comparable risks. Group accounts by class, size band, territory, and coverage structure so differences in price can be tied to real differences in exposure.
Normalize exposure. Express premium per unit of exposure, such as per $100 of payroll or per $100 of insured value, so accounts of different sizes can be compared.
Compare quoted price with technical price. Measure the gap between what the rating model produced and what the underwriter quoted.
Tag every deviation with a reason code. Require a short, structured reason for each credit, debit, or override.
Review the spread by underwriter, office, and broker. Look for patterns that point to a source on the variance map.
Build Comparable Cohorts
Cohorts decide whether the exercise is honest. Make them too broad and signal looks like noise. Make them too narrow and you have too few accounts to see a pattern. Start with a segment where you write enough volume to compare at least a handful of near-identical risks.
Track the Right Metrics
A small set of metrics tells you most of what you need. Review them on a regular cadence and watch the trend more than any single reading.
Metric | What it shows |
|---|---|
Spread of quoted-to-technical price ratio | How far quotes drift from the model |
Override rate | How often underwriters leave the model |
Override reason mix | Whether overrides cluster around a few causes |
Quote revision rate after clarification | How much intake quality is costing you |
Repeat-submission variance | Whether the same account gets the same price twice |
Set Tolerance Bands
Decide how much deviation from technical price is acceptable before a second review is required. Tolerance bands do not remove discretion. They make large deviations visible and give underwriters a clear path to defend them.
How to Reduce Pricing Variance Without Removing Judgment
The goal is not to turn underwriters into rule followers. The goal is to give them the same facts, the same reference material, and a visible record of why they deviated.
Standardize the Data at Intake
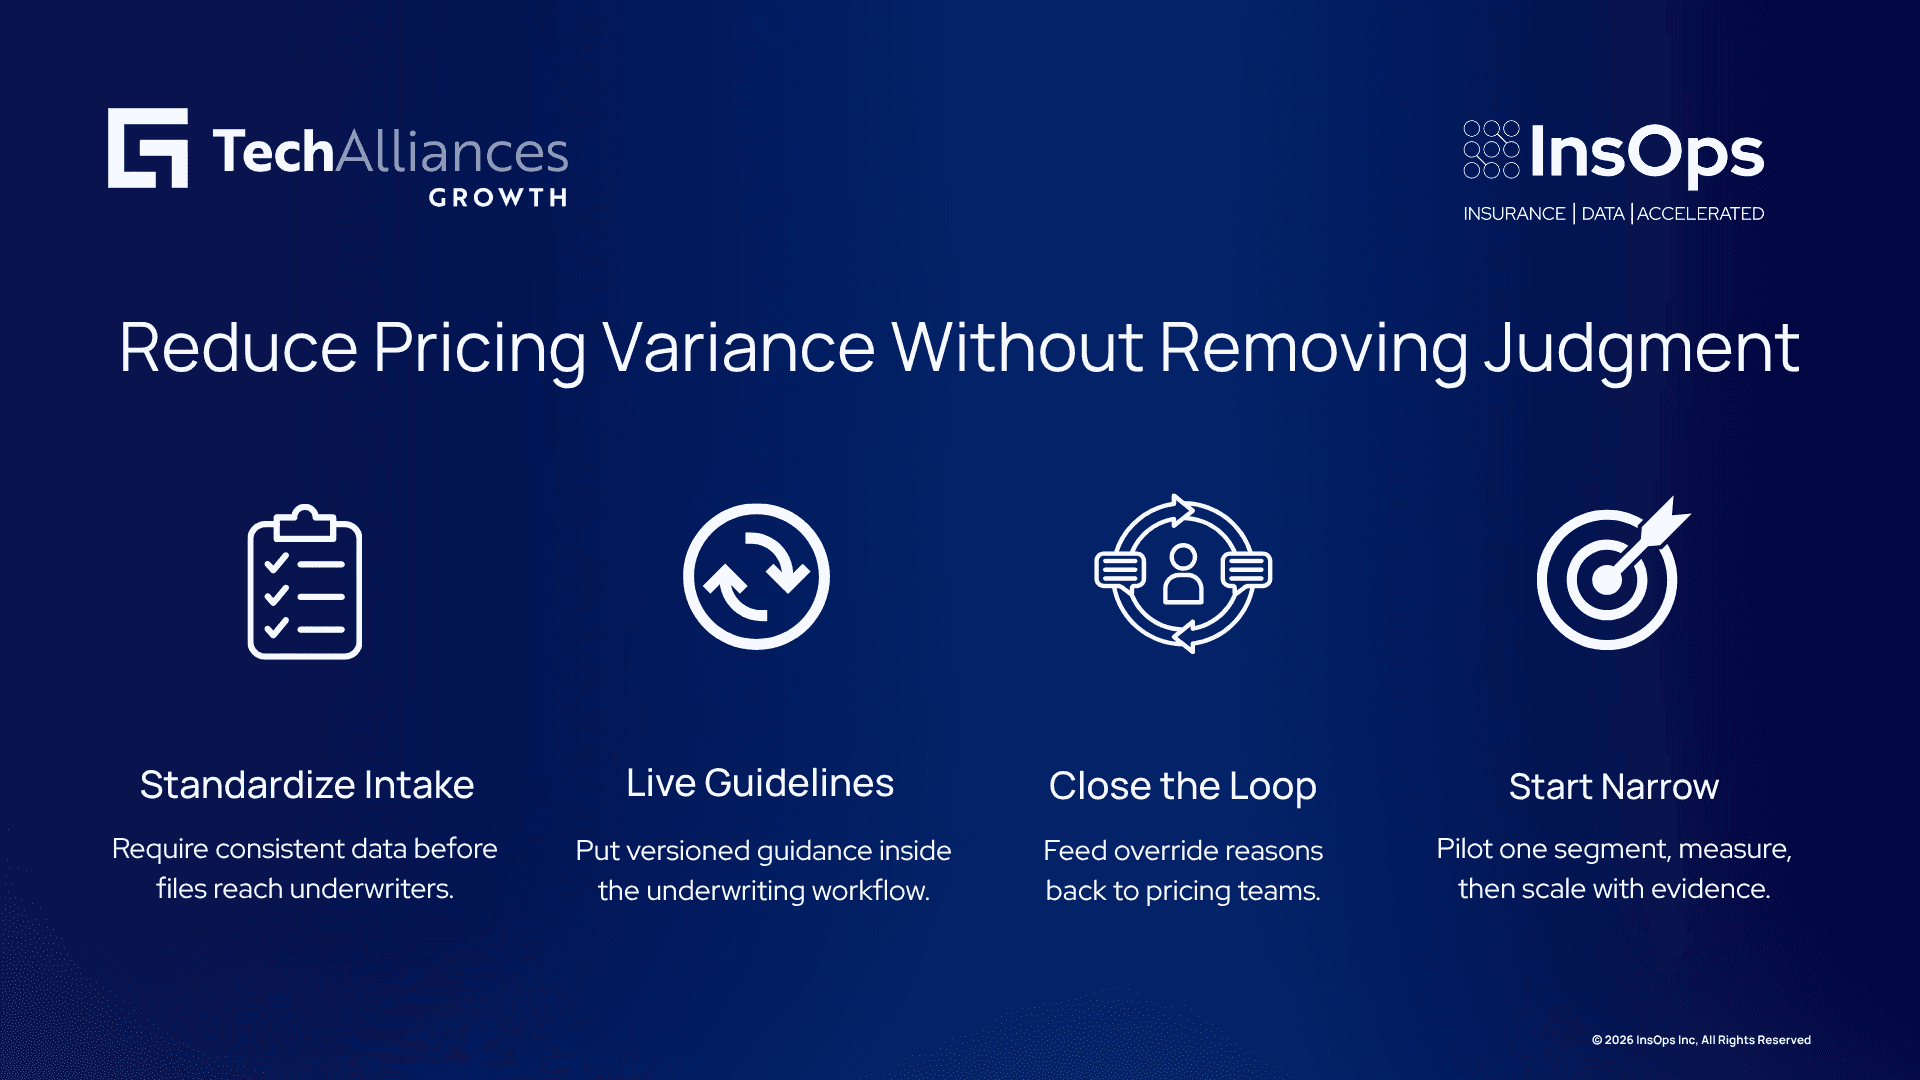
Start where variance starts. Define the mandatory data elements for each line, such as item-level schedules, valuation basis, and protection details, and require them in a consistent structure before a file reaches an underwriter. Underwriters then spend their time on evaluation instead of reconstruction.
Put Guidelines Where Underwriters Work
Replace static documents with guidance that sits inside the underwriting workflow and carries a version. When the rule changes, it changes for everyone on the same day.
Close the Loop With Pricing Teams
Treat every override as information. When reason codes flow back to actuarial and pricing teams, the model improves, and underwriters see their input reflected in the tools they use. Trust in the model rises, and off-model workarounds fall.
Start Narrow and Expand
Pick one line of business, one segment, and one broker cohort. Measure the baseline, make one change at a time, and measure again. A narrow start makes it clear which change moved the number, and it builds the evidence you need before scaling.
How InsOps Helps
InsOps builds an insurance-trained AI that assists underwriting teams in preparing consistent data before it reaches rating. LiLa, our insurance-trained LLM, interprets insurance fields and terminology, maps source fields to target structures, and standardizes formats. LiLa runs inside your own environment, so PII and PHI never leave controlled infrastructure.
A person reviews and validates every mapping before it is finalized. Your underwriters and your rating engine still set the price. LiLa prepares the data they work from.
Our Integration Gateway connects to Guidewire PricingCenter, UnderwritingCenter, and Quoting Services, so standardized data flows directly into your rating workflow without custom engineering.
InsOps migrates legacy data into Guidewire and keeps it flowing in real time.
If you are evaluating how to reduce pricing variance without adding another manual review step, contact us to talk through what this could look like for your operation.
Frequently Asked Questions
What is pricing variance in insurance underwriting?
Pricing variance is the spread in quoted premium across risks that share the same exposure profile. It includes signal, which reflects real differences in risk, and noise, which reflects differences in how a file was presented or handled.
Why do similar risks get different quotes?
Similar risks get different quotes because of differences at five points: how the submission is structured, how exposure is classified and entered, which reference material is used, how underwriters apply judgment, and how data moves between systems. Only some of those differences come from the risk itself.
How do you measure pricing variance?
Group comparable risks into cohorts, normalize premium per unit of exposure, and compare quoted price with technical price. Then tag every deviation with a reason code and review the spread by underwriter, office, and broker.
Is all pricing variance a problem?
No. Variance tied to real differences in the risk, to appetite, or to market conditions is healthy. The problem is variance no one can explain with a risk-based reason.
What is the most effective way to reduce pricing variance?
Fix the inputs first. Standardizing submission data at intake removes the variance that no underwriter chose, and it gives every underwriter the same starting facts. Reason codes and visible guardrails then address judgment noise.
Which metrics show whether the effort is working?
Track the spread of the quoted-to-technical price ratio, the override rate, the mix of override reasons, the quote revision rate after clarification, and repeat-submission variance. Watch the trend over several review cycles rather than a single reading.
How does InsOps assist with pricing variance?
InsOps assists with the data side. LiLa maps and standardizes insurance data so that rating inputs arrive in a consistent structure, and a person validates every mapping before it is finalized. Underwriters and rating engines continue to set the price.
What is a realistic timeline, and what are the common pitfalls?
Plan a phased rollout on one line of business. Spend the first phase on baselining and agreeing on reason codes, then standardize intake for one segment before expanding. Common pitfalls include cohorts that are too broad, reason codes that are too vague, and skipping the feedback loop to the pricing team.