

Your loss ratio is drifting away from target, and the explanations are familiar. Catastrophes, claims inflation, and social inflation all deserve blame, and all of them are real.
But some of the drift starts before a policy is bound. A construction class gets defaulted, a loss run gets transcribed wrong, or a renewal is priced without sight of a mid-term claim. The error is written into the premium, and it surfaces later as losses that do not fit the rating class.
This article covers how bad data becomes a higher loss ratio, the six data failures to look for, where they enter your workflow, how to test whether your drift is a data problem, and how to fix it at the source.
How Bad Data Becomes a Higher Loss Ratio
A loss ratio divides incurred losses by earned premium. The premium side of that fraction is set at underwriting, and it is only as accurate as the data behind it.
When the inputs are wrong, the premium is wrong, and the loss ratio records the difference years later.
The Pricing Error Starts at Intake
Rating factors such as location, construction, occupancy, and prior losses drive both premium adequacy and risk selection. Milliman's 2026 analysis of insurance data quality notes that one erroneous field can produce systematic mispricing across every account that shares it.
Consider a simple illustration. A commercial property submission arrives with construction type blank, and the system fills a default. The account is rated as a lower-hazard risk than it is, the premium is set, and the policy is bound.
Loss History Errors Distort Risk Selection
Loss history is the other input that moves pricing most. When a loss run is incomplete, transcribed inconsistently, or valued on the wrong date, an account with real frequency looks clean.
The underwriter selects a risk they would have priced differently with the correct history. Nothing in the file signals the gap.
The Error Surfaces Late
A loss ratio is a lagging measure. It reports decisions made months or years earlier, after the claims arrive.
By then, the underwriter who bound the account may have moved on, and the file rarely records which values were assumed. The drift appears in your reports with no visible cause.
Why It Looks Like Something Else
External pressures are real, which is why data problems hide among them. AM Best reported that continued rate increases in 2025 offset adverse trends such as social inflation and nuclear verdicts. It predicts the P&C industry combined ratio will rise 1.9 points to 96.9 in 2026 as rate gains flatten.
Rate increases cover a lot of pricing error. As that cushion thins, errors that were absorbed before start to show up in results.
The Six Data Failures Behind Loss Ratio Drift
Milliman defines insurance data quality across six dimensions. Each one maps to a specific way a loss ratio drifts.
Dimension | What fails | How it reaches the loss ratio |
|---|---|---|
Accuracy | Wrong class code, value, or occupancy | Risk is priced as a better risk than it is |
Completeness | Blank fields filled with defaults | Exposure is understated and premium runs low |
Consistency | The same account differs across documents or systems | The wrong figure feeds the rating |
Timeliness | Exposure or valuation data is out of date | Premium reflects last year's risk |
Validity | Values break format or business rules | Bad records pass into rating and reporting |
Uniqueness | Duplicate insured or policy records | Loss history splits across records and frequency looks lower |
Accuracy and Completeness
These two do the most direct damage. A wrong value produces the wrong premium, and a blank field filled with a default produces a premium based on an assumption.
Both are invisible to the underwriter unless a check flags them. The file looks complete because every field has a value.
Consistency and Timeliness
Consistency fails when two documents disagree on revenue, payroll, or class code. Someone has to decide which is right, and under time pressure the first figure often wins.
Timeliness fails when exposure data reflects last year's operations. A business that added a hazardous process gets rated on the old description.
Validity and Uniqueness
Validity failures let malformed records through, such as impossible dates or limits above policy maximums. Uniqueness failures split one insured across several records.
The second is quietly costly. When a claim history is spread across duplicates, the underwriter sees fewer losses than the account has.
Where the Data Breaks in Your Workflow
Data quality problems enter at predictable points. Finding yours is the first step toward fixing it.
Submission Intake
Submissions arrive as emails, PDFs, spreadsheets, and scans, and someone re-enters the values by hand. The Underwriting Edge 2026 survey of 350 senior commercial P&C underwriters in the US and UK found that 44% named inconsistent submission data as a major obstacle to better decisions.
The same survey found that 42% selected manual data entry between systems as the workflow problem they cited most often. Each manual step is a chance to introduce an error.
Between Systems
Policy, claims, and billing data usually sit in separate systems. An underwriter can price a renewal without seeing a claim that happened mid-term.
Our piece on data silos in P&C insurance covers how these gaps form and why they persist.
Analytics and Models
Pricing models inherit the quality of the data they consume. A model trained on defaulted fields learns the defaults as if they were facts.
Accenture's Underwriting Rewritten research surveyed 430 senior underwriting executives across life, commercial P&C, and personal P&C. Ineffective systems ranked as the top challenge at 65%, and only 33% said their organizations use solutions to gather, cleanse, and provide quality data views to underwriters to a large or very large extent.
An AM Best survey of more than 150 carriers and MGAs points the same way. Respondents named data readiness and integration with legacy systems among their largest impediments to deploying AI.
How to Tell If Your Drift Is a Data Problem
Not every rising loss ratio is a data problem. The audit below separates data-driven drift from external causes.
Segment the Drift
Start by finding where the ratio moved. Break it down by class, territory, broker, and intake channel.
Drift concentrated in one broker, one class, or one channel points to a process issue. Catastrophes and inflation spread across a book more evenly.
Audit Six Months of Bound Policies
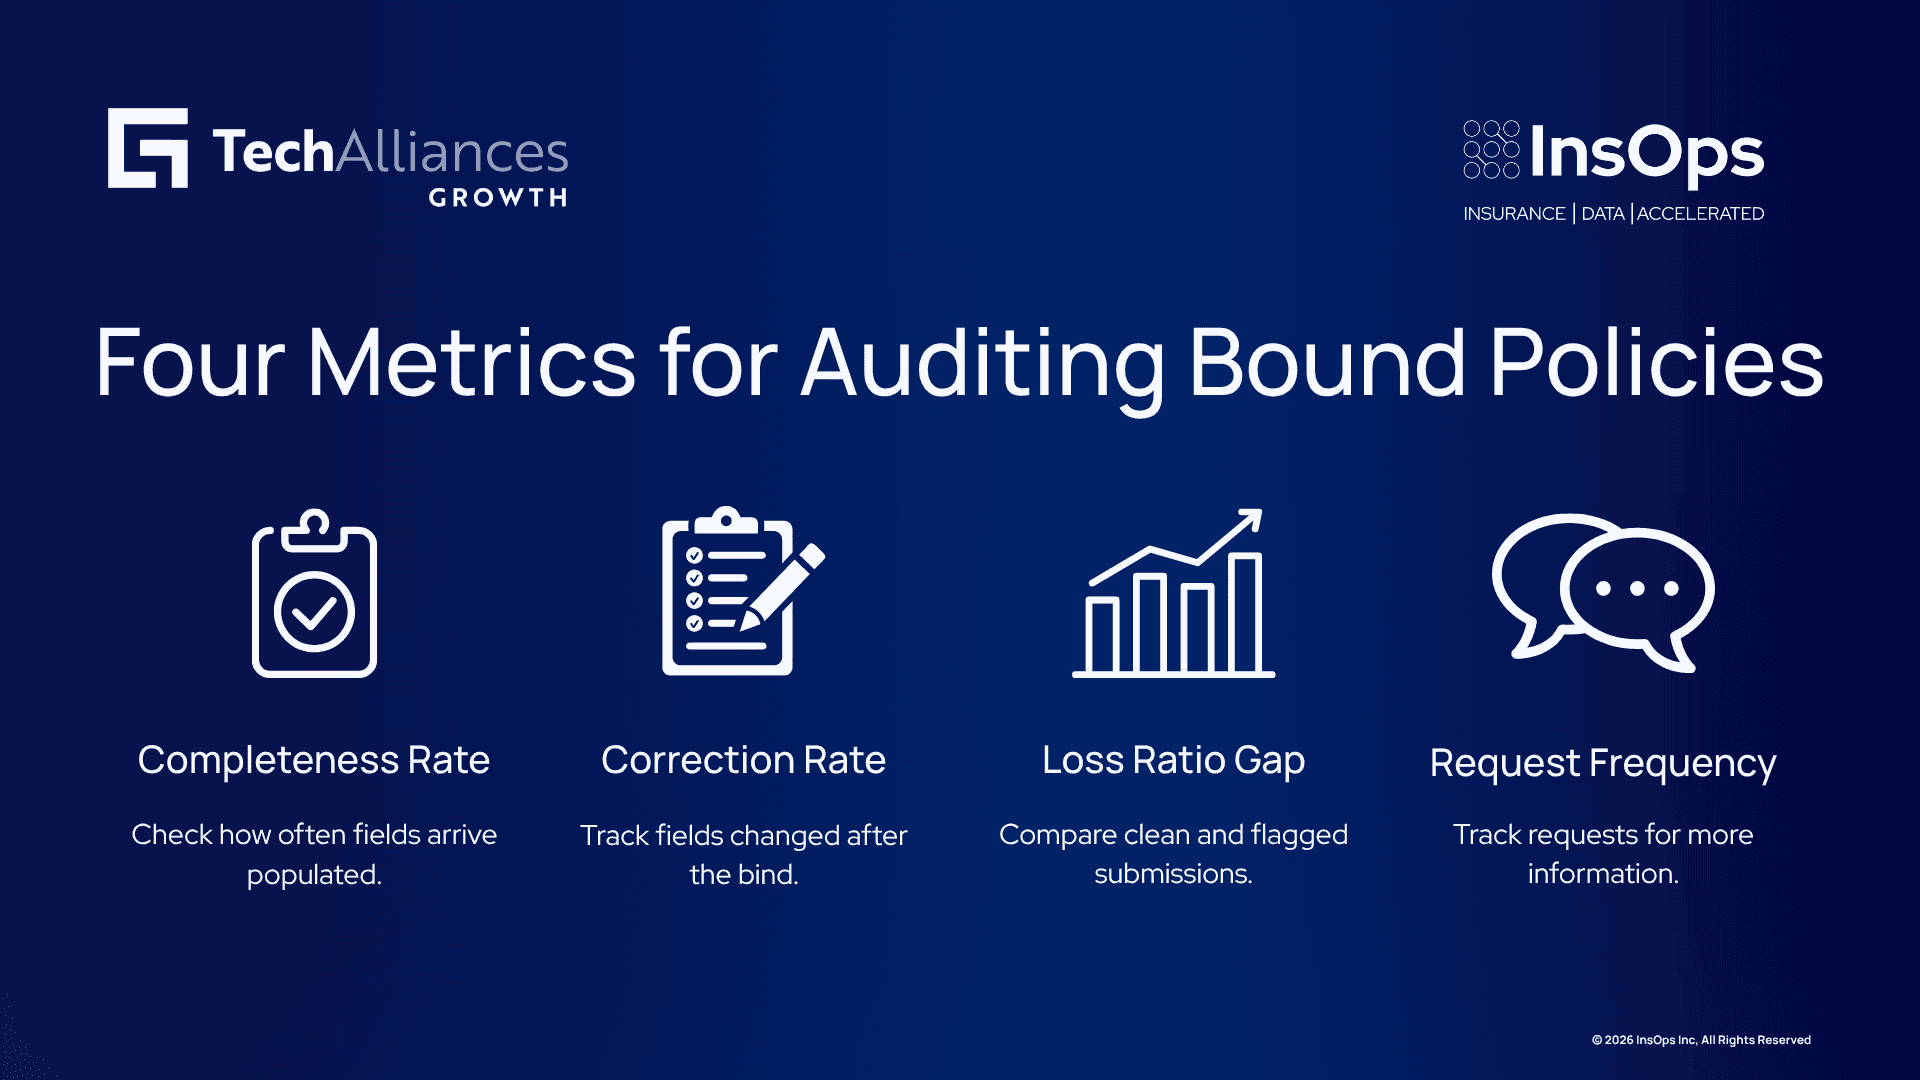
Pull six months of submitted and bound policies and measure four things for each rating field:
Completeness rate, meaning how often the field arrived populated with a real value.
Correction rate, meaning how often the field changed after bind.
Loss ratio difference between clean submissions and flagged ones.
Frequency of underwriter requests for additional information.
Fields with low completeness and a large loss ratio gap are your first remediation targets.
Rule Out External Causes
Compare your drift against catastrophe load, claims cost inflation, and rate change on the same segments. Drift that persists after those adjustments, and clusters in low-quality fields, is a data signal.
Keep the finding honest. The audit shows where data quality contributes, and it does not need to explain every point of movement.
Fixing Data Quality at the Source
Cleaning data after the fact is expensive and incomplete. The durable fix is to stop bad values at the point of entry.
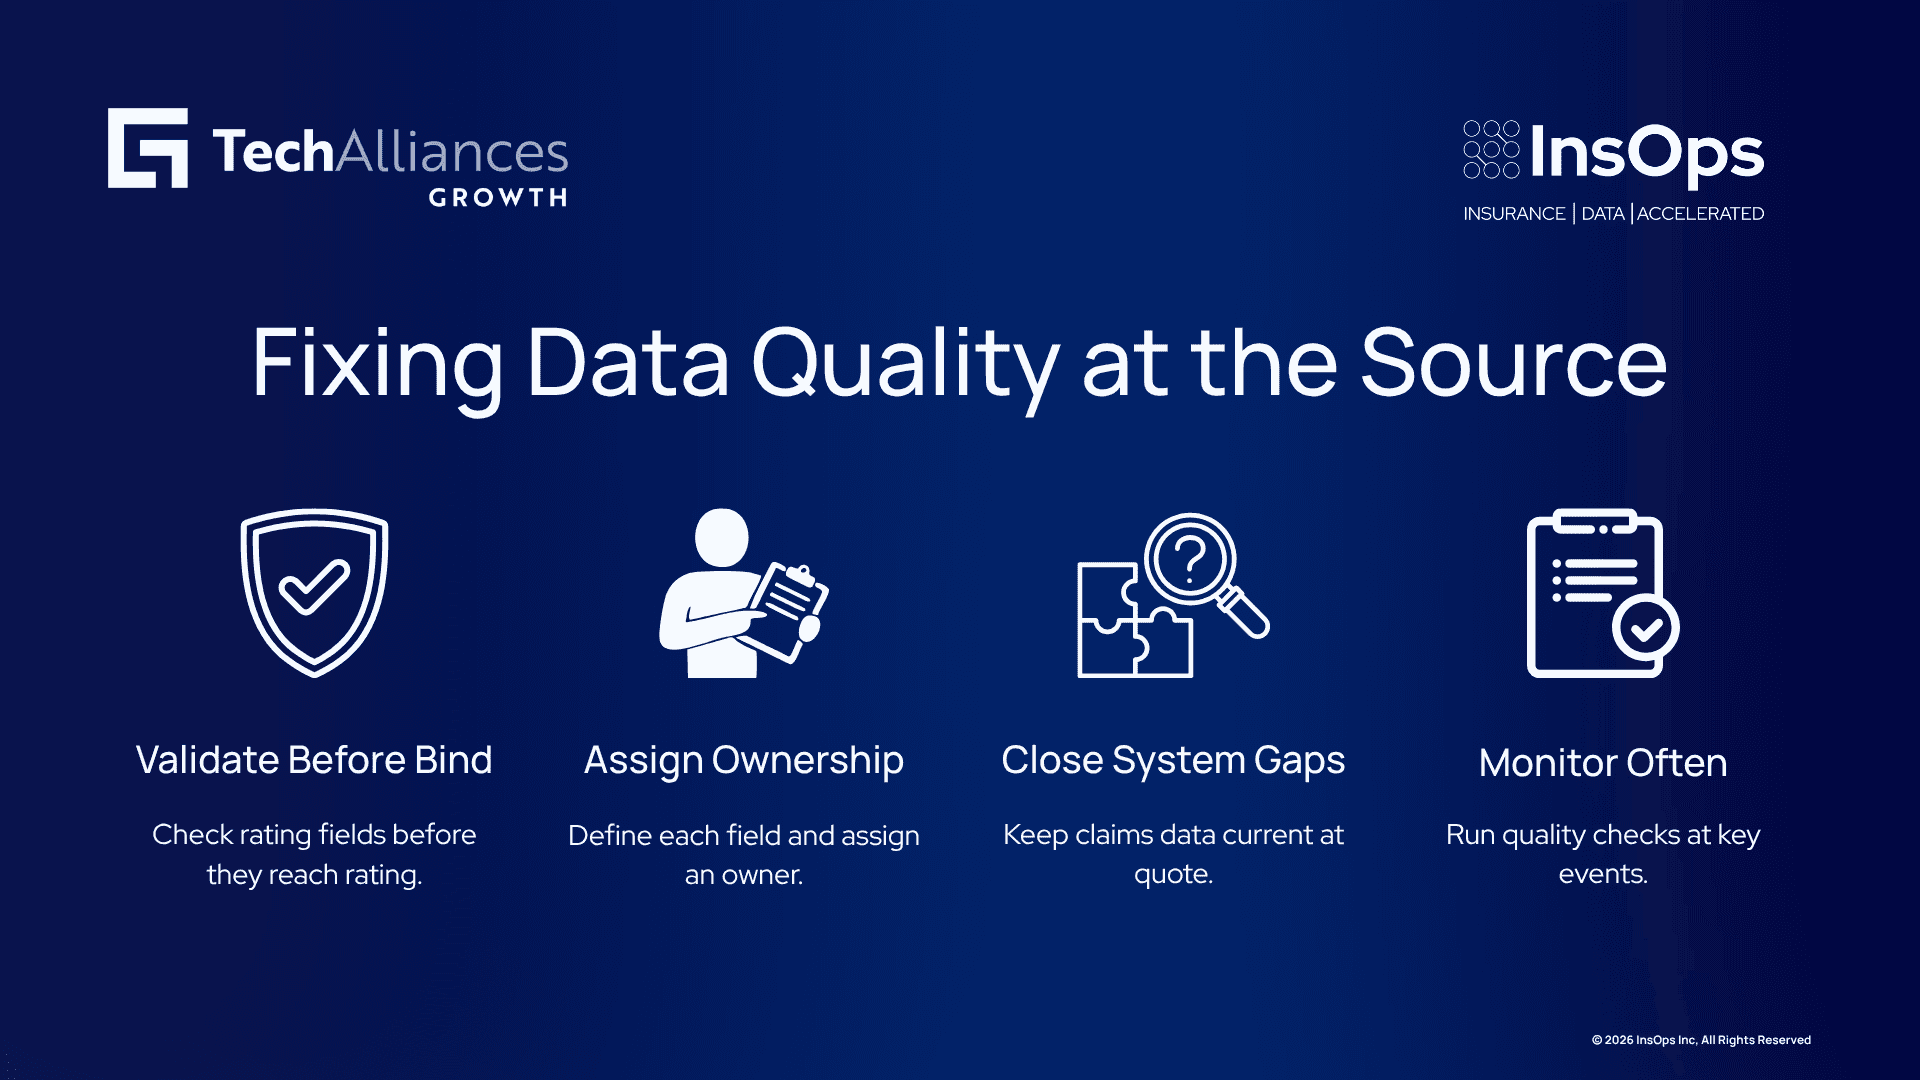
Validate Before Bind
Add checks at intake that reject defaults for required rating fields. Reconcile values across documents, and flag disagreements for an underwriter to resolve.
A person should review every low-confidence value before it reaches rating. That keeps judgment with the underwriter and stops silent assumptions.
Assign Field Ownership
Every rating field needs a definition and a named owner. When nobody owns a field, nobody notices when its quality slips.
Publish the definitions where underwriters and operations staff can see them. Consistent definitions remove most of the consistency failures in the table above.
Close the System Gaps
Underwriters need claims history visible at quote and renewal. Nightly batch files leave a window where the data is stale, so live systems should sync in real time.
Our underwriter copilot piece shows how consistent, well-structured data also supports more consistent decisions across a team.
Monitor Continuously
Milliman recommends running quality checks continuously, at key events such as system migrations, after any manual correction, and on a scheduled review at least quarterly. Treat data quality as an ongoing control, like reserving, and not a one-time cleanup.
How InsOps Helps
InsOps builds an insurance-trained AI that assists with the data work behind underwriting quality. LiLa, our insurance-trained LLM, runs inside your own environment, so PII and PHI never leave controlled infrastructure. A person reviews and validates every mapping before it is finalized.
Our Integration Gateway connects to Guidewire PolicyCenter, ClaimCenter, UnderwritingCenter, and Quoting Services, so data from your source systems flows into Guidewire in real time. LiLa validates and transforms each payload, and your team approves every mapping before deployment.
For systems you are retiring, GenGrate assists with one-time migration of historical policy and claims data. Migration and integration are separate decisions, and you can choose either or both. InsOps migrates legacy data into Guidewire and keeps it flowing in real time.
If you are evaluating how to improve the quality of your rating and loss data without a full system replacement, contact us to talk through what this could look like for your operation.
Frequently Asked Questions
What does it mean when a loss ratio is trending negative?
It means the ratio is climbing away from target. A loss ratio divides incurred losses by earned premium, so a rising ratio means claims costs are growing faster than premium.
Can data quality really change a loss ratio?
Yes. Wrong or defaulted rating fields cause mispricing, and mispriced accounts produce losses that do not match their rating class. The effect shows up months or years after the policy is bound.
How do we implement data quality controls?
Start with the rating fields that drive premium, and validate them at intake before bind. Assign each field a definition and an owner, and route low-confidence values to an underwriter for review.
What are the most common challenges?
Manual re-entry across formats, disagreement between documents, and disconnected policy and claims systems are the most common. Each one lets a wrong or default value reach the rating without a flag.
Which metrics show data quality is improving?
Track field completeness, the share of fields corrected after bind, and the loss ratio gap between clean and flagged submissions. Also track how often underwriters need to request missing information.
How does InsOps assist with data quality?
InsOps assists with mapping and validating data as it moves from source systems into Guidewire. LiLa drafts and validates the mappings inside your environment, and a person approves them before deployment.
How long does a data quality audit take?
Plan on two to three weeks for a six-month audit of bound policies on one line of business. Follow it with a six to eight week pilot of intake validation on the same line.
Is data quality the only reason a loss ratio rises?
No. Catastrophes, claims inflation, social inflation, and softening rates all move loss ratios. The audit separates those causes from data-driven drift so you fix the right problem.