

Most P&C insurers run portfolios with invisible imbalances. Too much premium concentrated in one geography. Too many policies clustered in a single line of business. Too much volume written through one agent or managing general agent (MGA). These imbalances lock up capacity that could chase profitable opportunities, leave the portfolio exposed to correlated losses, and make it harder to navigate regulatory and capital requirements.
Portfolio concentration risk isn't new. What's changed is the speed at which you can now surface it. A year ago, identifying concentration meant running monthly reports, pulling data from multiple systems, and waiting for hand-built dashboards to load. Today, portfolio analytics powered by AI can flag concentration patterns in real time, tell you exactly where your portfolio is exposed, and recommend where to adjust capacity allocation to improve profitability and resilience.
This article walks through how to identify portfolio concentration, why it matters, and how to use data and analytics to build a concentration-aware underwriting strategy.
What is Portfolio Concentration Risk?
Portfolio concentration is the uneven clustering of premium, exposure, or risk across your portfolio. Instead of spreading risk evenly across geographies, lines of business, risk profiles, and distribution channels, a concentrated portfolio has lumps—areas where your exposure is disproportionately high.
Common concentration patterns include:
Geographic concentration. Too much premium written in one state, county, or region. A severe hurricane, flooding event, or weather pattern can spike claims across a concentrated geography at once, creating correlated loss.
Line-of-business concentration. Overweight exposure to commercial general liability (CGL), workers compensation (WC), or property relative to the rest of the book. If that line faces adverse loss trends, the entire portfolio suffers.
Distribution concentration. Too much premium flowing through one agent, broker, or MGA. When a distributor leaves or underperforms, revenue drops sharply.
Risk-type concentration. Overexposure to small businesses, high-hazard industries, or high-risk customer segments. A downturn affecting that segment hits hard.
Premium concentration. A small number of large accounts generating a disproportionate share of premium, creating customer concentration risk.
The danger isn't that concentration exists—some concentration is inevitable and necessary. The danger is that concentration is hidden. You can't manage what you can't see.
Why Portfolio Concentration Matters
Concentration affects profitability, resilience, and compliance.
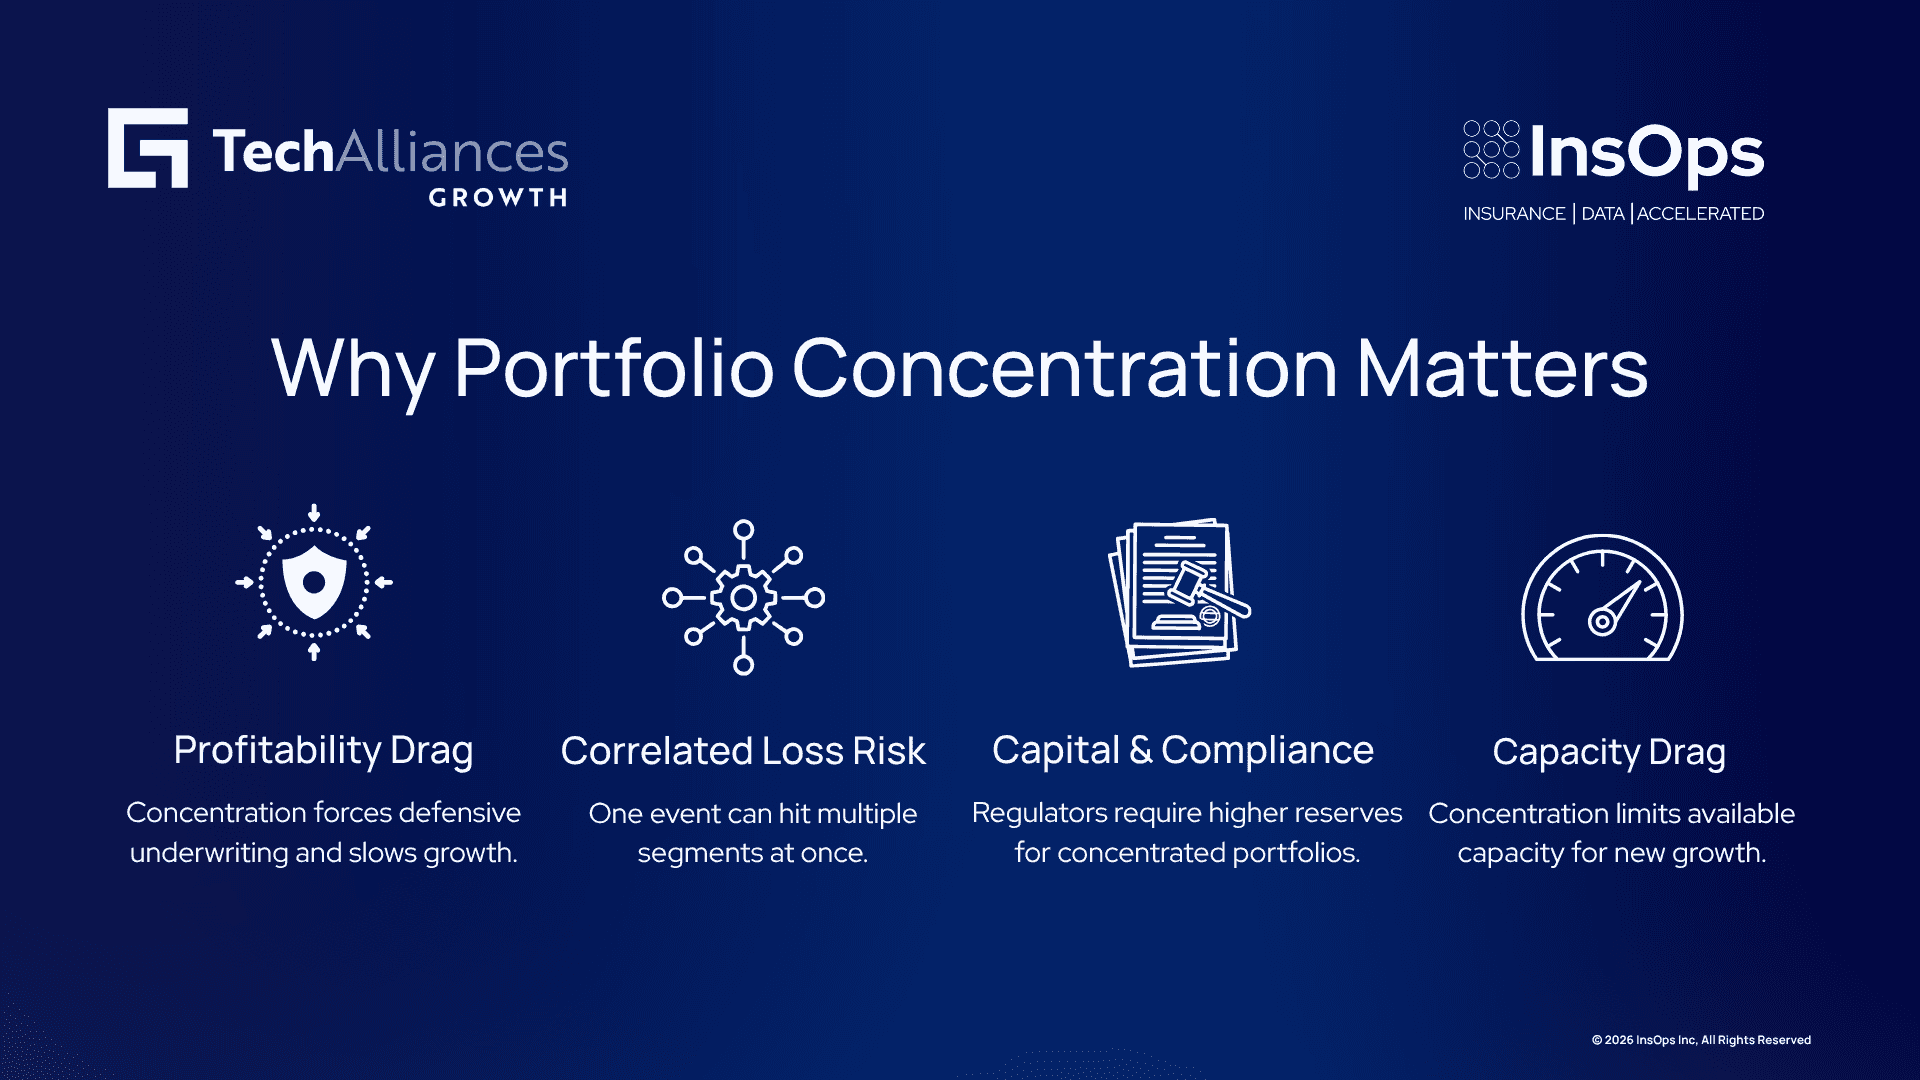
Profitability drag. Concentrated portfolios force underwriters to be defensive. If half your premium comes from one geography or line, you can't afford to underwrite aggressively in that area because a single adverse trend could wipe out profitability. Defensive underwriting means lower retention rates, tighter terms, or pulling out of the line entirely. Opportunities go to competitors. Growth slows.
Correlated loss exposure. A diversified portfolio spreads risk across independent or weakly correlated sources. A concentrated portfolio suffers when a single event—a hurricane, lawsuit trend, or economic shock—affects multiple segments at once. One bad year becomes a catastrophic year.
Capital and compliance friction. Regulators and rating agencies penalize concentration risk. They see a concentrated book as riskier and demand higher capital reserves. Internal risk committees flag concentration in audit and board reviews. Managing concentration becomes a compliance conversation instead of a strategic one.
Capacity drag. Concentration reduces effective capacity. If your overall book is $100M but $40M is concentrated in one geography, your true available capacity for growth is less than $60M. New opportunities in that geography must be turned down or squeezed into an already-tight allocation. Revenue suffers.
How to Identify Portfolio Concentration
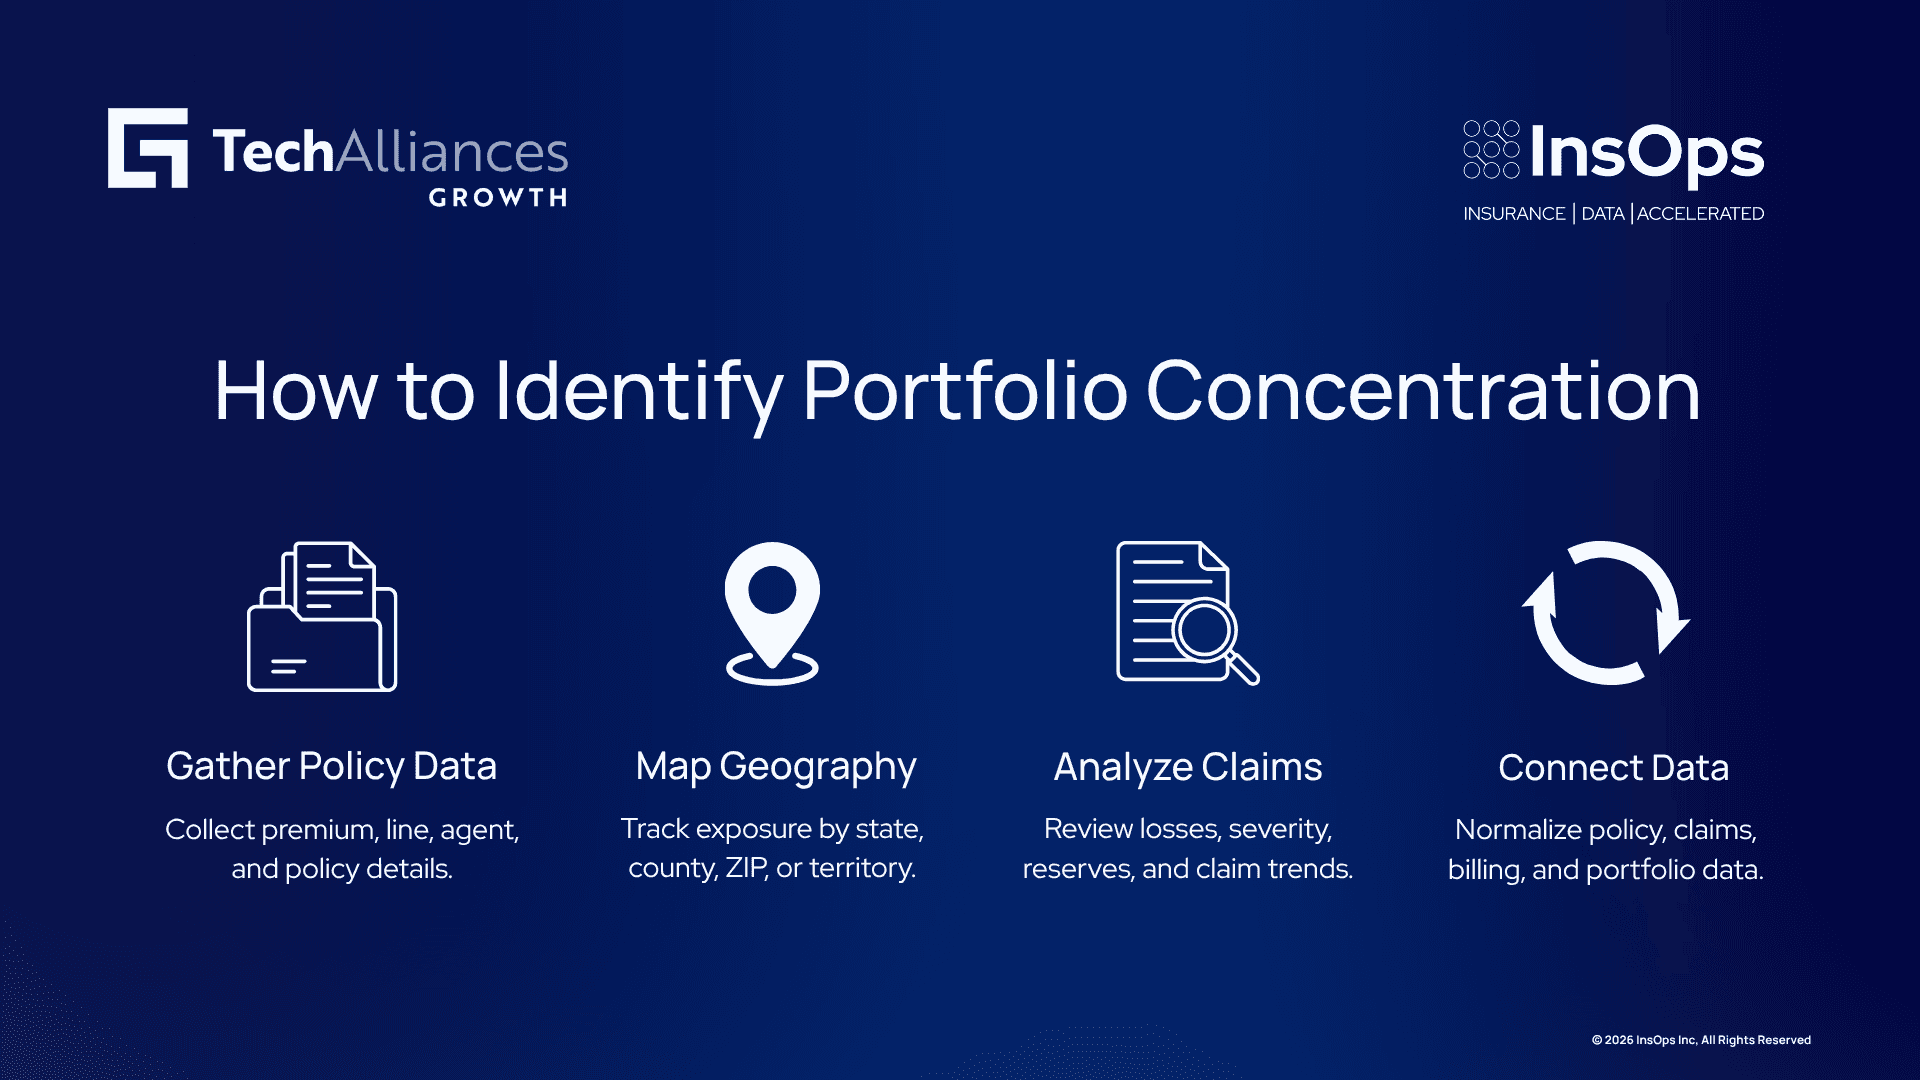
Identifying concentration requires data and visibility into three dimensions: premium distribution, exposure distribution, and loss experience.
Data You Need
Policy-level data. Account name, written premium, earned premium, line of business, effective date, expiration date, agent/MGA, customer classification.
Geographic data. State, county, or ZIP code for each policy. If you write by territory, territory codes and territory-level concentration targets.
Claims data. Open and closed claims by policy, line, geography, and fiscal year. Loss ratio, claim count, severity, and reserve trends.
Customer data. Customer industry, size (revenue or employee count), risk profile, and historical loss history.
Portfolio metadata. Underwriting guidelines, tier or rating tier assignments, concentration limits by geography or line.
This data often lives in your policy system (Guidewire PolicyCenter, AMS systems), claims system (ClaimCenter), and billing system (BillingCenter). Connecting and normalizing that data is the first step.
Concentration Metrics
Geographic concentration: Identify the percentage of total premium or exposure by state or region. Flag any geography representing more than 15-20% of total premium as high-concentration. Track loss ratio by geography to identify regions driving adverse trends.
Line-of-business concentration: Calculate premium as a percentage of total premium for each line. A typical target is no single line exceeding 25-35% of total premium. Track loss ratios by line to spot underperforming lines that are also concentrated.
Distribution concentration: Rank agents and MGAs by premium volume. Flag any agent/MGA representing more than 10-15% of total premium. Identify whether concentration is growing or shrinking year over year.
Premium concentration (account-level): Identify the top 10 accounts and their collective percentage of total premium. A portfolio where the top 10 accounts exceed 20-30% of premium faces customer concentration risk.
Loss concentration: Rank claims by severity and count. Identify whether losses are concentrated in specific geographies, lines, or customer segments.
Red Flags to Watch
A single geography exceeding 25% of premium
A single line of business exceeding 40% of premium
Top 5 agents/MGAs representing more than 40% of premium
Top 10 accounts representing more than 30% of premium
Growing concentration year over year in any segment
Adverse loss trends concentrating in high-concentration segments
Using Analytics to Optimize Capacity
Once you've identified concentration, the next step is to optimize capacity allocation. This is where AI-driven portfolio analytics create leverage.
Rebalancing Strategies
Geographic rebalancing. Reduce underwriting appetite in high-concentration geographies and redirect capacity to underutilized geographies. Lower premiums or tighten terms in Florida if it represents 30% of your book; expand appetite in Texas or Colorado if they're at 5%.
Line-of-business rebalancing. Reduce new business volume in concentrated lines. Increase market presence and agent engagement in underutilized lines.
Distribution rebalancing. Diversify your agent and MGA mix. Build relationships with new distributors in underutilized channels. If one MGA represents 20% of premium, consciously diversify by recruiting other MGAs in that channel.
Customer segment rebalancing. Adjust underwriting criteria, pricing, or availability by customer size, industry, or risk profile to balance customer concentration.
Dynamic Capacity Allocation
Manually adjusting underwriting guidelines once a year no longer works. Portfolio analytics should feed into underwriting guidelines in real time or on a quarterly basis.
A modern portfolio approach works like this: Every underwriter logs into their system and sees their geography- and line-specific capacity allocation. The allocation updates quarterly based on actual portfolio results, loss trends, and concentration metrics. An underwriter writing Florida commercial property sees, "You have $5M capacity remaining in Florida Q3 due to concentration limits." They know instantly that their next opportunity in Florida needs to go elsewhere.
This requires integration between portfolio analytics and underwriting systems so that capacity recommendations flow into underwriting tools, guidelines, and decisions.
Portfolio Scenario Planning
Before committing to new business, run portfolio scenarios. "If we write $10M more in this geography, what does our portfolio concentration look like? Do we violate risk limits? What does capital impact?" Scenario tools help underwriters and underwriting managers make concentration-aware decisions at the point of offer.
Building a Concentration Monitoring Framework
Identifying and optimizing concentration is not a one-time project. It's an ongoing discipline.
Review Frequency and Cadence
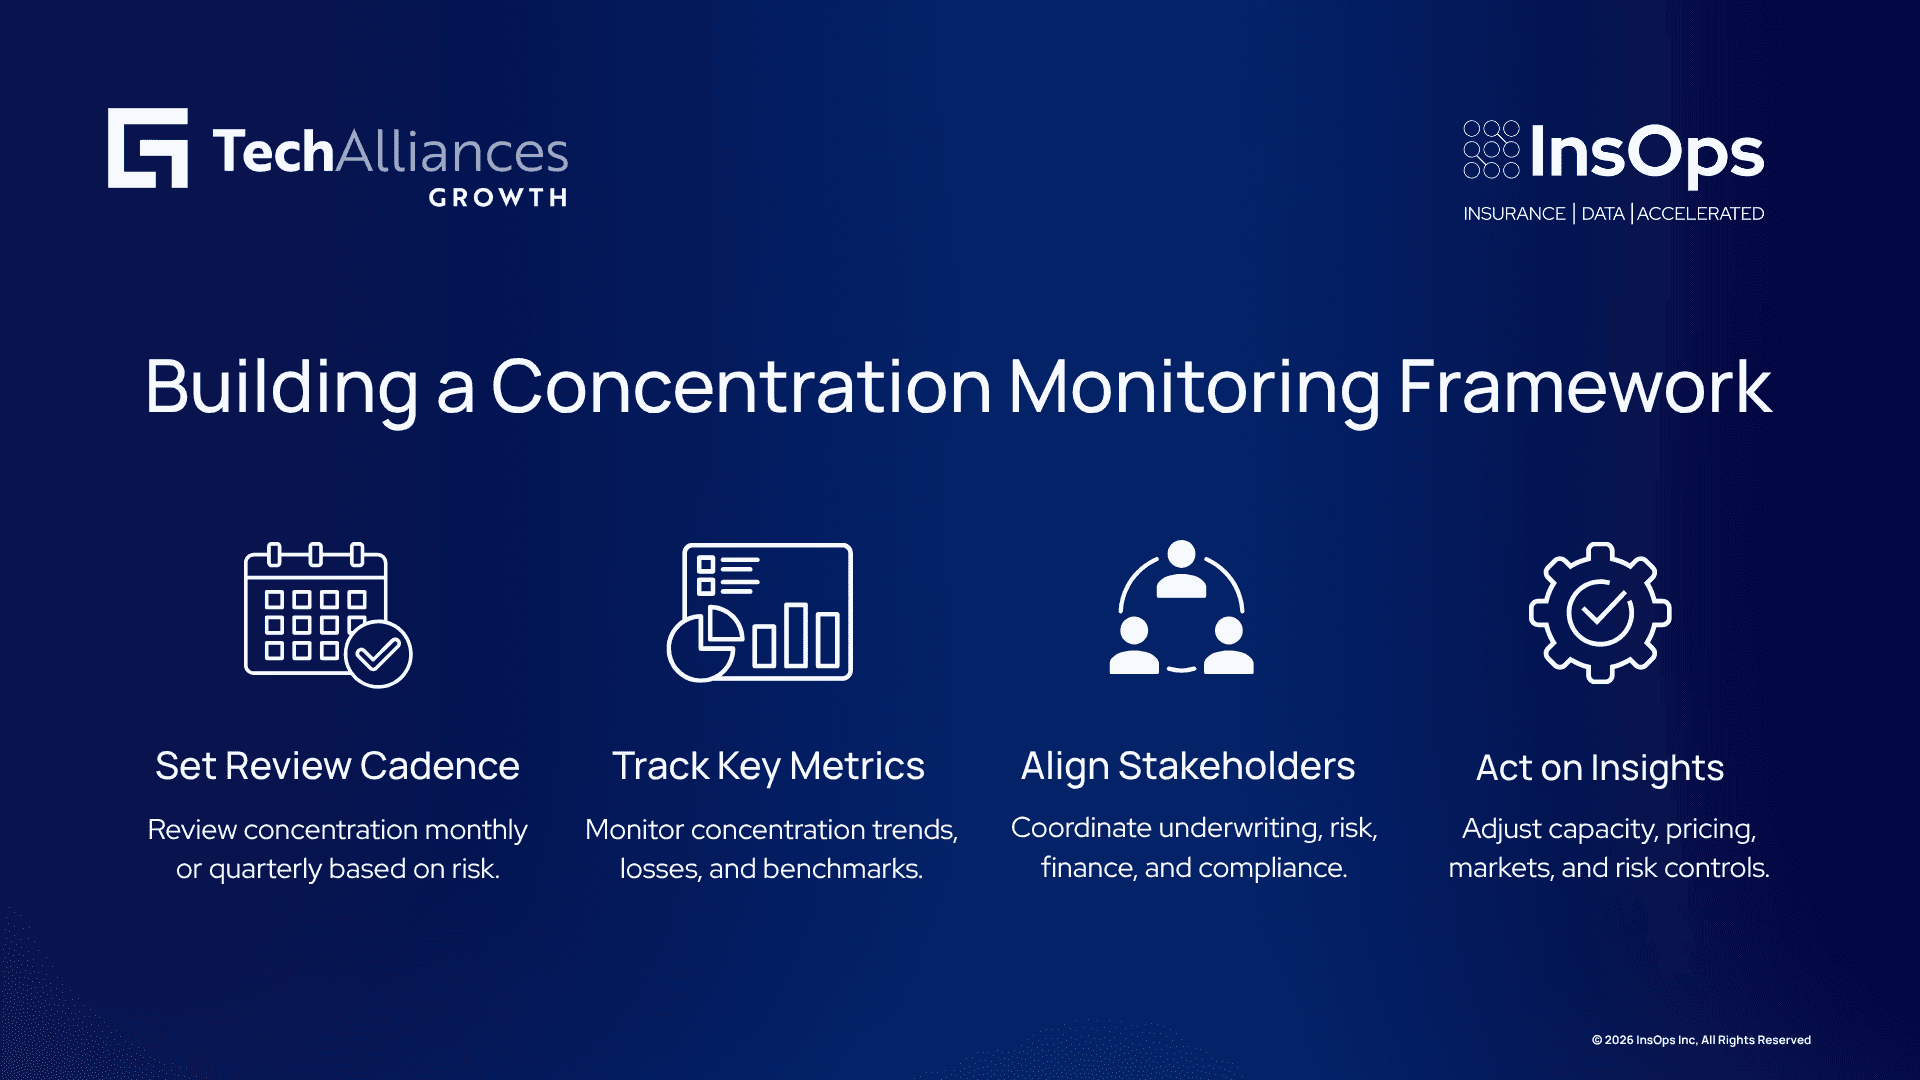
Establish a formal concentration review rhythm. Some organizations review quarterly; others do it monthly. The cadence depends on market volatility, growth rate, and how quickly your portfolio moves.
Formal reviews should include:
Portfolio concentration dashboard reviewing key metrics by geography, line, agent, and customer
Year-over-year concentration trends
Loss ratio trends by concentration segment
Comparison to industry benchmarks and internal targets
Stakeholder Alignment
Concentration monitoring isn't an analytics function alone. It requires alignment across underwriting, risk, compliance, and finance.
Underwriting leadership needs to know their concentration targets and capacity allocations each quarter.
Risk management needs to know concentration trends relative to risk appetite.
Finance and actuarial need to track concentration impact on loss ratios, reserves, and capital.
Compliance and legal need to track concentration relative to regulatory expectations and rating agency feedback.
Misalignment here causes problems. Underwriting chases growth without knowing portfolio concentration. Risk is blind to capacity constraints. Finance and underwriting are out of sync on what "diversified" means.
Acting on Insights
Concentration monitoring is useful only if insights drive action. Common actions include:
Adjust underwriting strategy and capacity in high-concentration segments
Expand market presence in underutilized geographies or lines
Renegotiate or exit relationships with concentrated distributors
Reprice or re-tier concentrated segments to reduce attractiveness
Increase loss control and risk engineering in concentrated high-loss segments
Without action, monitoring becomes reporting. Reports don't reduce concentration.
How InsOps Helps
InsOps has portfolio concentration analytics and AI-driven capacity optimization inside LiLa, our insurance-trained AI. The goal: surface portfolio concentration patterns automatically, recommend rebalancing actions, and integrate capacity recommendations directly into Guidewire underwriting systems so underwriters see real-time capacity constraints at the point of decision.
A person reviews and validates every recommendation before it affects underwriting guidance. This is not autonomous decision-making; it's AI-assisted analysis with human oversight at every step.
If you are evaluating how to surface portfolio concentration and optimize capacity without expensive custom analytics builds, contact us to talk through what this could look like for your operation.
Frequently Asked Questions
What counts as "too much" concentration?
Industry benchmarks vary, but a common target is no single geography exceeding 20% of total premium, no single line exceeding 35%, and no single agent/MGA exceeding 15%. Start with these; adjust based on your risk appetite, capital position, and business model.
How often should we monitor portfolio concentration?
Formal reviews quarterly are a practical baseline. For high-volatility markets or rapid-growth carriers, monthly monitoring may be necessary. Real-time dashboards let underwriters see concentration impact in their daily decisions.
Can concentration ever be a strategic choice?
Yes. Some carriers intentionally concentrate in a specific geography or line where they have expertise or competitive advantage. That's a conscious risk decision, not a blindness to risk. The key is knowing that concentration exists and having a plan to manage it.
How does concentration affect pricing and retention?
Concentration forces underwriters to be defensive on renewal. If your book is already 30% Florida property, you can't afford to be aggressive on the next Florida property renewal. You either hold premium flat or raise it to reduce attractiveness. This drives retention down. Diversified portfolios can be more aggressive on renewal without concentration penalty.
What's the relationship between portfolio concentration and loss reserves?
Concentrated portfolios require higher reserves. If your reserves are calculated based on the assumption of a diversified portfolio, but your actual portfolio is concentrated, you're probably underreserved. Actuarial models should account for concentration in reserve recommendations.
Can AI help identify concentration automatically?
Yes. AI can scan portfolio data, identify concentration patterns, and flag them faster than manual reporting. It can also run scenario analysis—"what if we write X more in this geography?"—to model concentration impact before a decision is made. InsOps has this capability; contact us to learn more.