

The insurance industry is at a crossroads. Traditional underwriting relied on historical loss data and area-wide rules. That approach no longer works.
Global insured losses exceed $100 billion annually for the fifth consecutive year. The insurance protection gap for natural catastrophes now stands at 60%, meaning roughly $8 in every $10 of catastrophe losses go uninsured. In the first half of 2025 alone, $131 billion in economic losses from disasters were recorded—yet only $80 billion was covered by insurance.
Insurers are responding by withdrawing from high-risk markets. State Farm nonrenewed 72,000 policies in California. California's FAIR Plan (the insurer of last resort) grew 152% in three years. But withdrawal leaves coverage gaps that create market dysfunction.
Underwriters who integrate real-time geospatial and climate data can differentiate risk at the asset level instead. This keeps premium carriers in the market with precise pricing and maintains underwriting margins.
This article explains how catastrophe models work, how climate data changes underwriting decisions, and how to implement these practices. For carriers building this integration, connecting vendors and normalizing data is the operational challenge—InsOps.ai assists with real-time data mapping and validation in underwriting workflows.
What Is Catastrophe Modeling?
Catastrophe modeling is a computer-based process that simulates thousands of plausible disaster scenarios to estimate the financial impact of natural hazards on an insurer's portfolio.
The method emerged in the late 1980s and accelerated after Hurricane Andrew (1992) and the Northridge earthquake (1994). Both events caused losses far exceeding what historical data predicted. Modelers realized that statistical simulation—not just historical loss ratios—was necessary to understand low-frequency, high-severity events.
The Four-Module Framework
Per the NAIC Catastrophe Modeling Primer (2025), CAT models have four integrated components:
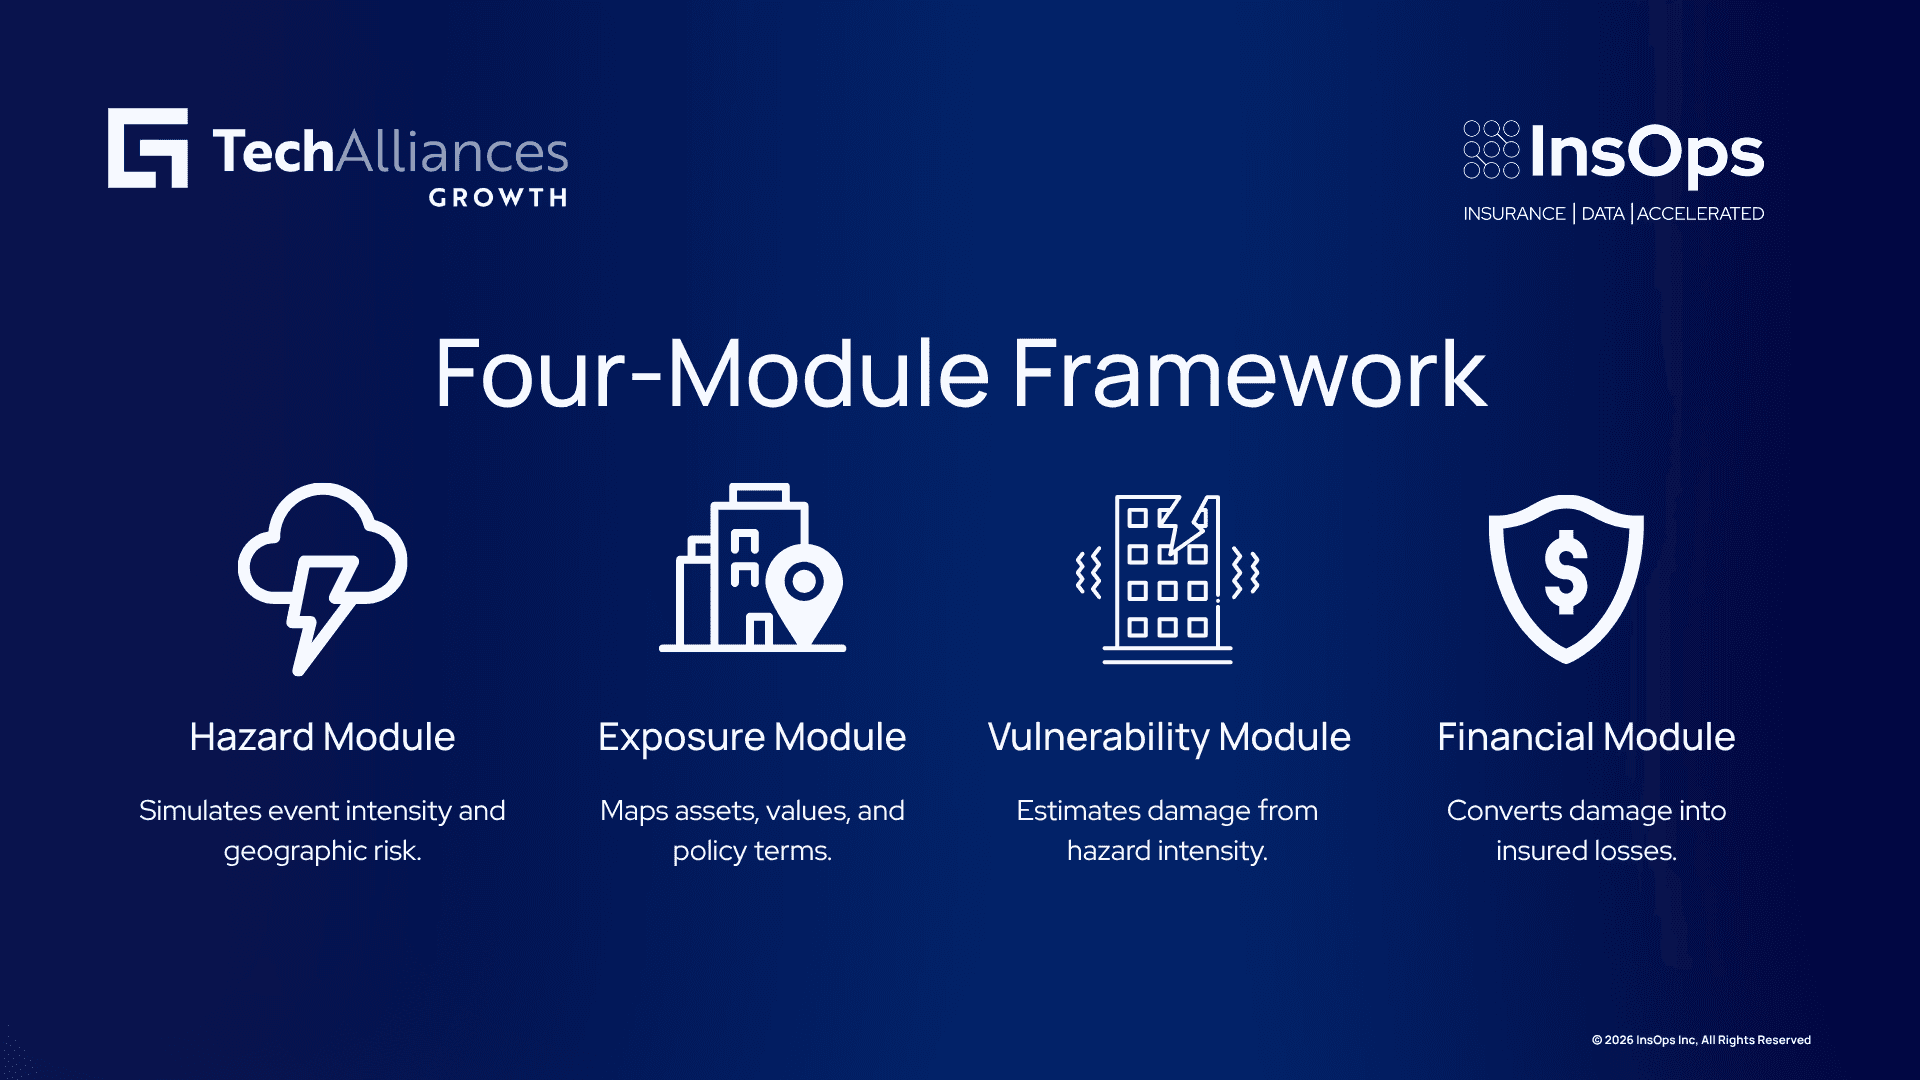
Hazard Module: Simulates event intensity, path, and frequency at the geographic level. Input is historical and forward-looking climate data. Output is a "hazard footprint"—a geographic risk grid showing wind speeds, flood depths, or other intensity measures for each potential event.
Exposure Module: Creates an inventory of assets at risk. Pulls property location (geocoded by latitude/longitude), construction type, occupancy, value, and age from policies and property databases. Includes policy terms: deductibles, limits, reinsurance.
Vulnerability Module: Applies "damage functions"—mathematical equations that convert hazard intensity to expected physical damage. A wood-frame home 1 mile inland experiences 35% damage from a specific hurricane; a concrete structure 2 miles inland experiences 5% from the same storm.
Financial Module: Converts physical damage into insured loss dollars. Applies policy conditions (deductibles, limits, loss adjustment expenses). Outputs estimated insured loss per policy and portfolio aggregate.
Together, these modules produce event loss tables, year loss tables, and exceedance probability curves—the key outputs underwriters use to price policies and manage portfolio risk.
How Climate Data Changes Underwriting
The shift from historical to forward-looking is unavoidable. Historical data is no longer reliable because climate is non-stationary—event frequency and severity are increasing faster than historical records show, and geographic risk profiles are shifting.
Traditional underwriting: Area-wide rules ("exclude this ZIP code"). Pricing based on historical loss ratios. Outcome: broad market withdrawal.
Climate-aware underwriting: Property-specific, address-level risk assessment. Pricing based on modeled future loss plus regulatory capital requirements. Outcome: precise differentiation; market persists.
Regulatory pressure is forcing the transition. NAIC now requires climate-conditioned catastrophe exposure disclosure for hurricane and wildfire in P&C Risk-Based Capital filings (effective year-end 2024). European insurance regulators (EIOPA) mandate climate scenario stress testing. California allows catastrophe models for wildfire rate determination.
Three data layers anchor climate-aware underwriting:
Hazard data: Flood risk maps, wildfire exposure scores, hurricane frequency models, real-time updates. Critical for emerging signals.
Exposure data: Property details (construction type, roof age, defensive features), location precision (address-level geocoding), prior claims history.
Vulnerability data: How specific structures respond to specific perils. A 150 mph wind damages wood-frame homes differently than concrete; a 12-foot flood impacts 1st-floor differently than basement.
The real-world impact is address-level specificity. Old approach: "This ZIP code is flood-prone; decline all flood coverage." New approach: "This property is 0.3 miles from a 100-year floodplain, elevated on higher ground. Model shows 3% annual loss probability. Premium: $X."
Precision keeps carriers in market instead of abandoning high-hazard zones.
The Underwriting Workflow: Step-by-Step
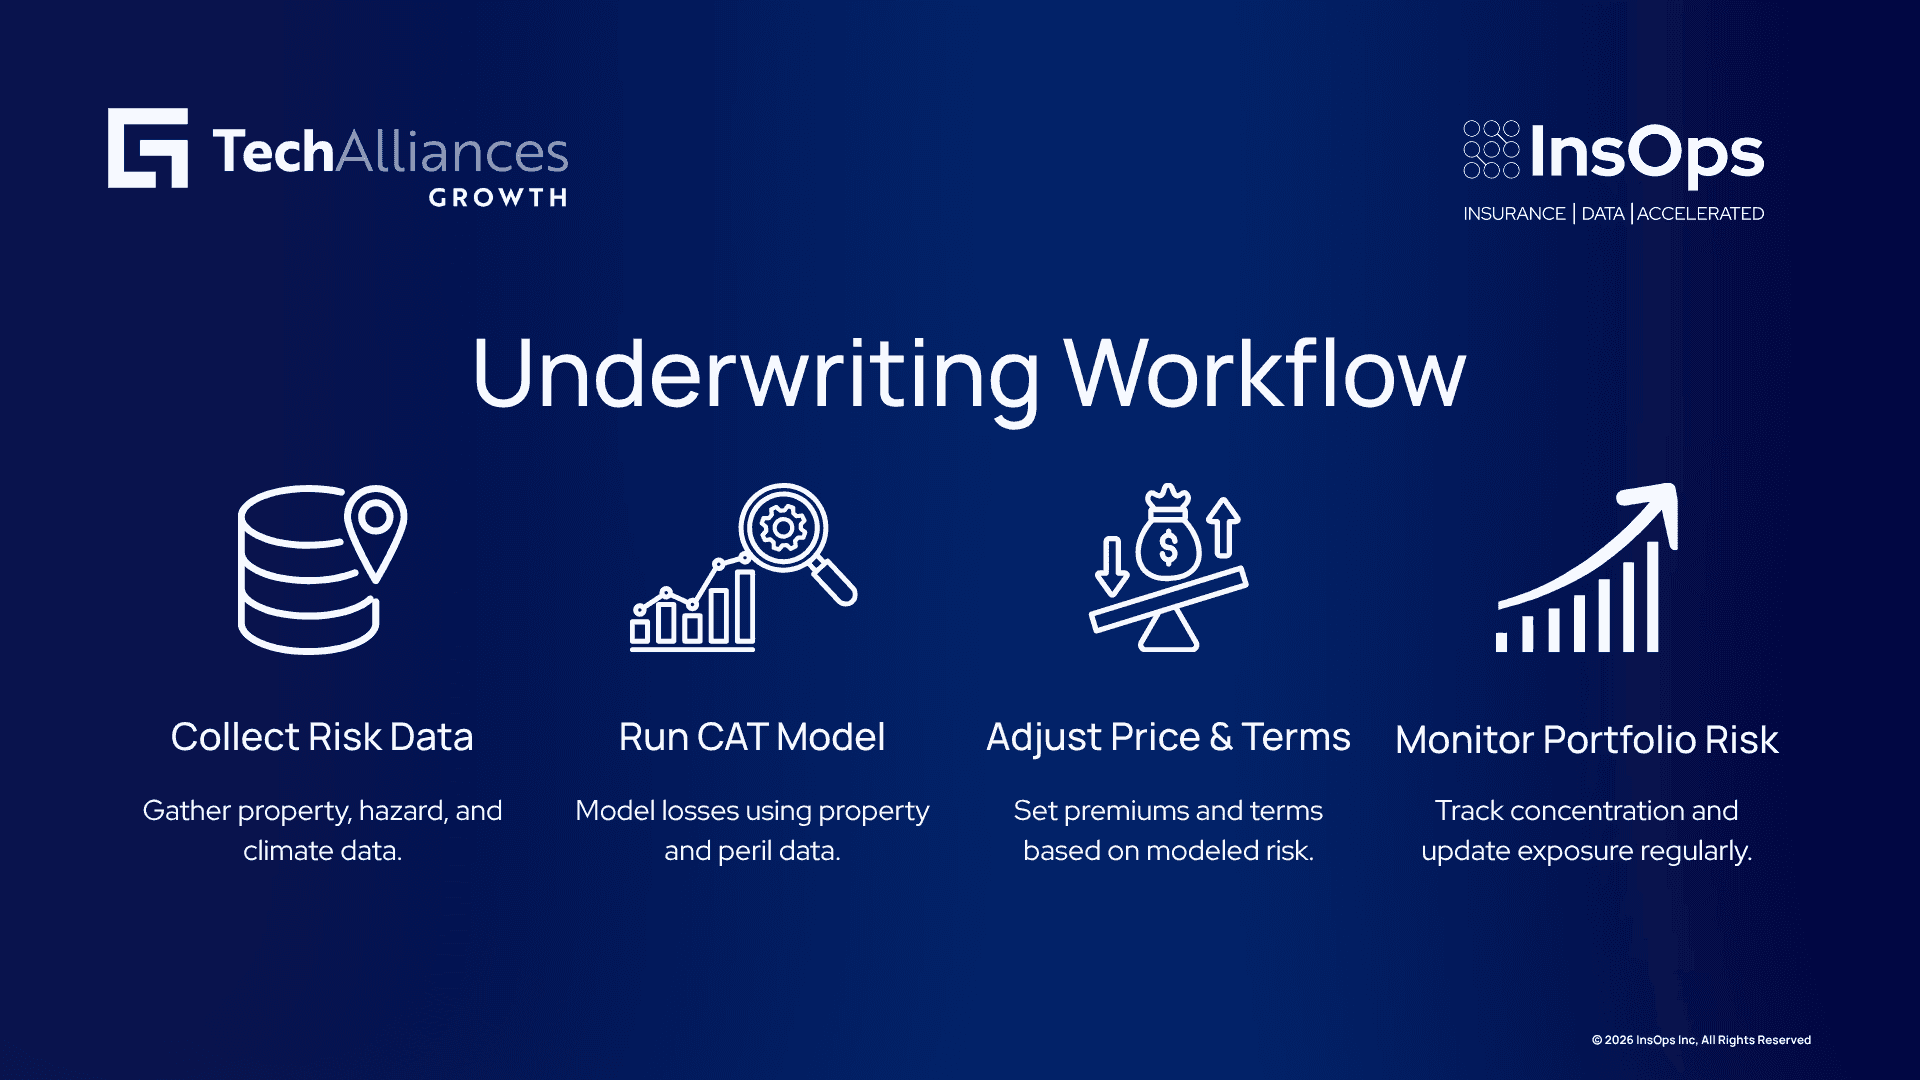
Step 1: Collect Climate + Property Data
At quote time, underwriters gather property details (address, construction type, roof age, prior loss history), pull hazard data (flood exposure, wildfire risk score, hurricane probability), and integrate climate projections (5-year, 10-year, 30-year scenarios if available). Real-time data feeds from weather APIs and CAT model vendors integrate directly into underwriting systems.
Step 2: Run CAT Model
Underwriter submits property exposure data (location, construction, value, deductibles, policy limits) and perils of concern. Model returns:
Expected annual loss (EAL): "This property has $1,200 annual average loss potential"
Probable maximum loss (PML): "In a 1-in-100-year hurricane, potential loss is $45,000"
Exceedance curves: "5% chance of loss exceeding $8,000; 1% chance exceeding $25,000"
Loss ratio by peril: "70% flood; 25% wind; 5% other"
Human review validates whether modeled output aligns with property specifics.
Step 3: Adjust Pricing & Terms
Premium = (Expected Annual Loss / Target Loss Ratio) + Expense Loading + Profit.
Example: If EAL = $1,200 and target loss ratio = 65%, base premium = $1,846 plus expenses.
Underwriter can override for exceptions (new roof offset, tenant improvements). Terms adjust: higher deductibles for high-risk properties, coverage limits capped on concentrated zones, conditions tied to mitigation (e.g., "Clear 30 feet defensible space from structures").
Step 4: Monitor Portfolio Concentration
Aggregate all active policies by peril and geography. Check against carrier limits (e.g., "No more than $500M exposure in CA hurricane zone"). Alert if approaching limits. Quarterly: rerun portfolio through CAT model with latest climate data; update exposure reports.
Traditional vs. Climate-Aware: The Difference
Dimension | Traditional | Climate-Aware |
|---|---|---|
Data | Historical ratios (10–20 years) | Forward models + current conditions |
Assessment | Area-wide rules | Property-specific, address-level |
Pricing | Regulatory rate filings; annual updates | Dynamic, modeled future loss + capital requirements |
Response | Market withdrawal from high-risk zones | Precise risk differentiation; market persists |
Outcome | Broad exclusions; insurance gap widens | Individual pricing; availability maintained |
The market impact is stark. Traditional approach: State Farm exits California; FAIR Plan balloons; private market shrinks. Climate-aware approach: carriers remain in market with adjusted pricing; risk competition maintained; policyholders can take mitigation steps (roof replacement, defensible space, elevation) to improve pricing.
Both approaches face an affordability-availability tradeoff. Climate-aware underwriting maintains market presence longer by pricing risk precisely rather than withdrawing entirely.
Real-World Implications
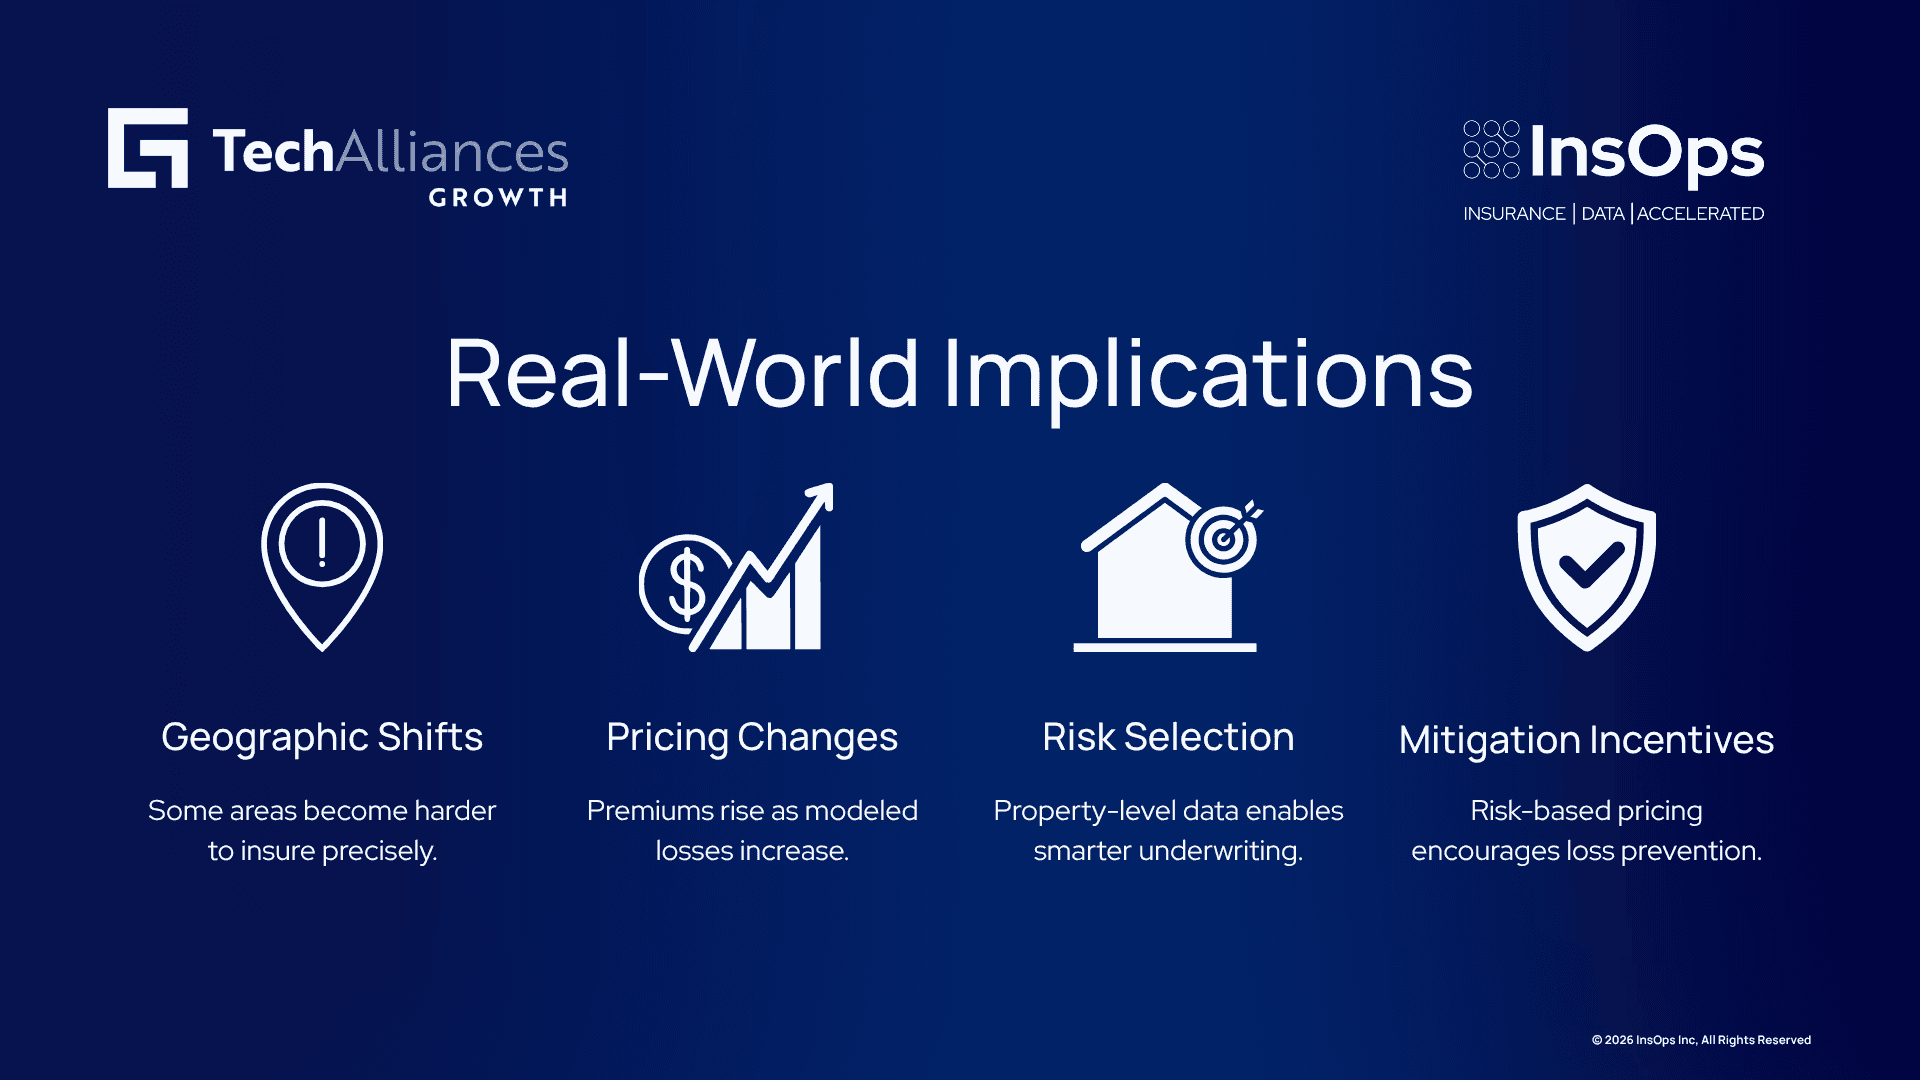
Geographic Shifts
Certain areas approach uninsurability: repetitive loss zones, coastal Florida with rising sea levels and storm surge stacking, California wildfire-earthquake exposures. Other high-hazard zones remain insurable with precise pricing: inland flood-exposed properties with strong mitigation, commercial properties with proper business interruption coverage structure.
Pricing Changes
California homeowner premiums up 30–50% since 2022. Florida coastal property premiums up 60–80%. These increases reflect modeled loss, not carrier greed. An EAL of $3,000 requires $4,600+ premium (at 65% loss ratio); a historical $1,500 premium was underpriced.
Risk Selection Precision
Precise underwriting allows new business in high-hazard zones with proper pricing. Renewal decisions are based on current modeled risk, not historical rules. Property 123 Main St. and 125 Main St. are differentiated by flood elevation, construction, prior claims—not broad ZIP-code exclusions.
Policyholder Behavior
When pricing is risk-based, homeowners have financial incentive to mitigate: roof replacement yields 10–15% premium reduction; wildfire defensible space yields 5–20% reduction; elevation/flood barriers yield 15–30% reduction. This drives mitigation adoption long-term, reducing insured losses.
Brokers now need to understand underwriting rationale (not just "yes/no"), communicate pricing based on property specifics, suggest mitigation tied to discounts, and manage carrier appetite by geography.
The Data Challenge Ahead
Quality matters. Geocoding errors, missing fields (roof age, construction type), inconsistent vendor definitions all corrupt model output. Underwriters must validate; the work adds 5–10 minutes per quote.
Integration is evolving. Most carriers still disconnect CAT model output from underwriting systems manually. Best practice: API integration so results flow directly to quote point, with real-time hazard feeds updating automatically.
Freshness is critical. Most CAT models run annually (e.g., "climate assumptions updated in Q1"). Real-time hazard data (weather, wildfire conditions) updates daily. The gap between model vintage and current conditions exists. Hybrid solutions use annually-refined frameworks plus real-time hazard feeds.
What's Next
Emerging signals underwriters should monitor: compound events (drought + wildfire + hail simultaneously), shifting atmospheric patterns (El Niño, Atlantic oscillations) not yet in most CAT models, regulatory evolution (climate-scenario stress testing mandatory 2025+).
Carriers are developing new strategies: parametric insurance (payout tied to hazard intensity, not actual loss), public-private partnerships (pooling risk across geographies), managed retreat (strategic nonrenewal in highest-risk zones; investment in lower-risk regions).
The challenge for underwriters is moving from reactive (pull back after losses) to proactive (monitor accumulation, adjust limits, price dynamically). For carriers building this workflow, integration—connecting vendors, normalizing data, ensuring human-in-the-loop validation—is the operational blocker.
Key Takeaway
Climate-aware underwriting isn't theoretical. It's already here. Underwriters who understand how catastrophe models work, how to interpret climate data, and how to defend pricing decisions to brokers will operate more effectively as the industry transitions from area-wide rules to asset-level precision. The carriers that master this shift maintain market presence. Those that don't withdraw entirely.
How InsOps Helps
InsOps builds an insurance-trained AI that assists with real-time data mapping and validation in underwriting workflows. LiLa, our insurance-trained LLM, runs inside your own environment, so PII and PHI never leave controlled infrastructure. A person reviews and validates every underwriting recommendation before it is finalized.
Our Integration Gateway connects to Guidewire PolicyCenter, UnderwritingCenter, and other core systems, so climate data flows directly into your underwriting decision point without custom engineering.
InsOps migrates legacy data into Guidewire and keeps it flowing in real time.
If you are evaluating how to integrate climate data into your underwriting workflow without months of custom integration work, contact us to talk through what this could look like for your operation.
Frequently Asked Questions
What is catastrophe modeling in insurance underwriting?
Catastrophe modeling is a computer-based process that simulates thousands of potential disaster scenarios to estimate the financial impact of natural hazards on an insurer's portfolio. It helps underwriters price policies and manage portfolio risk by moving beyond historical loss data to forward-looking scenario analysis.
Why is catastrophe modeling important for underwriters?
Historical data alone no longer predicts future risk because climate is non-stationary—event frequency, severity, and geographic patterns are changing. Catastrophe models incorporate forward-looking climate data to help underwriters price accurately without over-withdrawing from high-risk markets.
How does climate data change underwriting decisions?
Climate data enables address-level risk assessment instead of area-wide rules. Rather than excluding entire ZIP codes, underwriters can differentiate risk based on specific property characteristics, hazard exposure, and vulnerability. This precision allows carriers to maintain market presence with accurate pricing.
What are the four modules of a catastrophe model?
Hazard (simulates event intensity and frequency), Exposure (identifies assets at risk), Vulnerability (estimates damage based on building characteristics), and Financial (converts physical damage to insured loss dollars). Together, these produce loss estimates underwriters use for pricing and portfolio management.
How long does it take to implement climate-aware underwriting?
A phased approach starting with one line of business or peril is most effective. Common implementation challenges include integrating with legacy underwriting systems, ensuring data quality, and establishing consistent triage criteria. With proper planning, basic integration can begin within weeks, with full portfolio implementation over 3-6 months.
What metrics should I track to know if climate-aware underwriting is working?
Time from application to underwriting decision, percentage of policies rerouted after initial assessment, average premium accuracy by territory, and loss ratio by peril are key indicators. These reveal whether your triage system is identifying the right risks for the right pricing paths.
Can AI assist with climate-aware underwriting without automating underwriter decisions?
Yes. Human-in-the-loop models use AI to evaluate climate data, flag concentration risks, and recommend pricing adjustments—but underwriters retain final decision authority. This approach leverages AI efficiency for data analysis while preserving human judgment for complex or edge-case decisions.